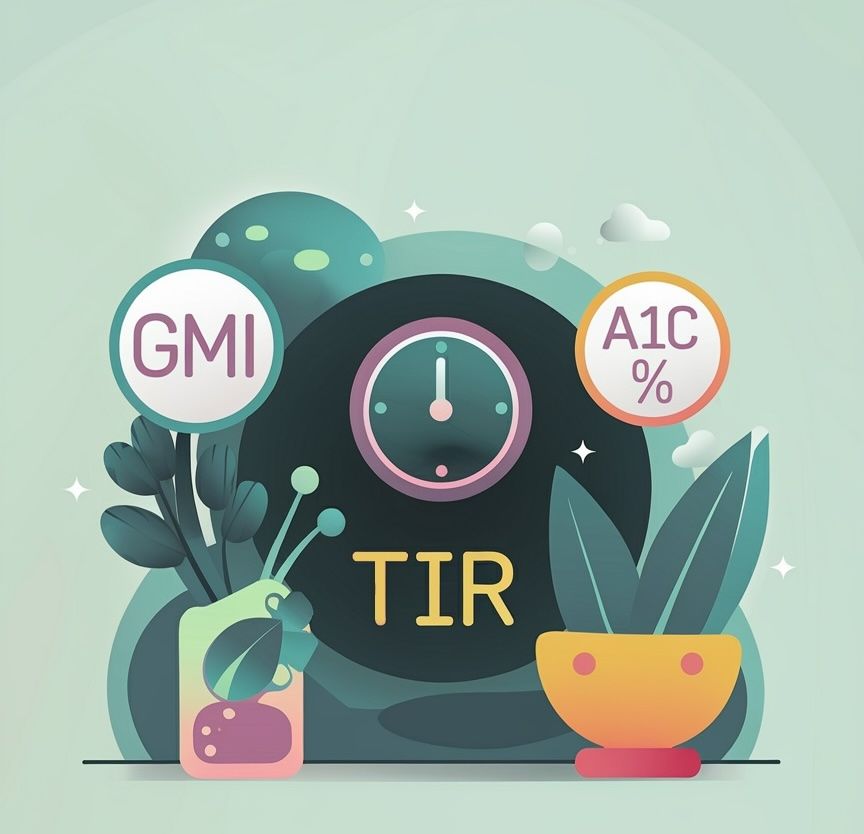
Understanding your glucose levels is an important part of managing diabetes—but it’s not just about the numbers on your glucose meter. Living with diabetes is a daily journey that goes much beyond metrics. It’s about how you feel, the choices you make, and finding a balance that works for your life. That said, having the right tools and knowledge can make a big difference. There are several key metrics that offer a clearer picture of your blood sugar control, helping you manage not just the highs and lows, but everything in between. These include the Glucose Management Indicator (GMI), Time in Range (TIR), and A1C. This article will delve into these three important glucose metrics. We'll explain what they are, how they're measured, and why they're essential for effective diabetes management.
What is A1C and Why is it Important?
A1C, also known as hemoglobin A1C, is a widely used glucose metric for diabetes management. It measures your average blood glucose levels over the past two to three months. This longer-term view offers valuable insight into overall blood sugar control.
Doctors often use A1C to assess the effectiveness of a person's diabetes treatment plan. Lower A1C levels are usually a sign of good blood sugar control. Learn more here about normal blood glucose levels for people with & without diabetes.
One of the benefits of the A1C test is its convenience. It doesn't require fasting and can be done anytime, providing flexibility for those undergoing regular monitoring. You can typically get an A1C test at your doctor’s office, a local clinic, a laboratory or at a pharmacy.
It's important to note that A1C might not accurately reflect glucose levels in some individuals. Conditions like anemia or certain hemoglobin disorders can affect the accuracy of A1C measurements. Despite this, it remains a cornerstone in evaluating diabetes control. However, it doesn’t reveal daily glucose fluctuations, which can be a limitation.
The Role of Glucose Management Indicator (GMI)
The Glucose Management Indicator (GMI) is a newer glucose metric that complements A1C. It offers a fresh perspective by utilizing data from continuous glucose monitoring (CGM) systems. Unlike A1C, which gives a historical average, GMI reflects more current glucose control.
One of the main advantages of GMI is its ability to predict A1C levels based on real-time data. This provides a more dynamic overview of blood sugar control, allowing for timely adjustments. Because it's derived from CGM data, GMI can reflect daily glucose variations.
Healthcare providers use GMI to gauge potential diabetes complications. A lower GMI suggests better glucose management and reduced health risks. It serves as a valuable tool for fine-tuning diabetes care plans.
It's important to understand GMI’s limitations. Factors like sensor accuracy and calibration can affect its readings. Regular discussion with healthcare professionals is essential to maximize GMI's benefits.
How GMI is Calculated and Interpreted
GMI is calculated using your CGM’s average glucose data over 14 days or more. Here’s how it works:
For glucose in mg/dL (used in the US):
- GMI (%) = 3.31 + 0.02392 × Average Glucose
For glucose in mmol/L (used in other countries):
- GMI (%) = 12.71 + 4.70587 × Average Glucose
The result is an estimated A1C percentage, which you can compare to your lab-measured A1C. GMI % works like A1C:
- Normal range: 4–5.6%
- Pre-diabetes: 5.7–6.4%
- Diabetes: 6.5% or higher
For example, if your GMI is 7.0%, it means your average glucose is close to what’s expected for an A1C of 7.0%.
Interpreting GMI requires context, as it reflects daily glucose patterns. It helps identify potential hypoglycemia or hyperglycemia incidents. Discussing GMI results with a healthcare team ensures a comprehensive approach.
Time in Range (TIR): A Crucial Metric for Daily Management
Time in Range (TIR) is gaining recognition as a key glucose metric for diabetes management. It shows the percentage of time your glucose levels stay within the target range. Unlike A1C, which averages your levels over months, TIR provides insight into daily glucose control.
Monitoring TIR can reveal trends and patterns in your daily glucose levels. It highlights when your blood sugar is too high or too low. This real-time feedback allows you to make immediate lifestyle changes, improving overall management.
Experts recommend keeping TIR above 70% for most adults with diabetes. Achieving this target can reduce the risk of developing diabetes-related complications. It's essential to set personal goals, as factors like age, lifestyle, and health conditions vary for each person. Managing glucose after meals is particularly challenging for many. You can find here a list of foods with low glycemic index - and some tips on how they can help avoid spikes in blood sugar levels after meals.
CGM systems and diabetes apps like SNAQ play a pivotal role in tracking TIR, offering continuous glucose data. This modern technology makes it easier to stay informed and adjust your strategies as needed.
Setting Personal TIR Goals
Managing diabetes is a journey, and setting Time in Range (TIR) goals is a powerful way to take charge of your health. Remember, TIR targets aren’t one-size-fits-all—they’re as unique as you are.
Some people may aim for more time in range, while others might focus on specific periods, like staying steady after meals. The key is to set goals that are realistic, safe, and aligned with your lifestyle. Partner with your healthcare provider to create a plan that works for you and feels achievable.
By regularly monitoring your glucose levels and using tools like Continuous Glucose Monitoring (CGM), you can uncover patterns and make adjustments. Every small improvement counts, and these insights can help you and your healthcare team celebrate wins and tackle challenges together. You’ve got this!
Comparing GMI, TIR, and A1C: Understanding the Differences
GMI, TIR, and A1C are vital glucose metrics for diabetes, each offering unique insights. A1C has long been a standard measure, reflecting average glucose levels over two to three months. It's simple and widely used but lacks detail about daily fluctuations in blood sugar.
In contrast, GMI, or Glucose Management Indicator, provides an estimated A1C using data from continuous glucose monitoring (CGM) systems. It offers a more dynamic view, reflecting recent glucose trends and potentially indicating risks sooner than A1C alone.
TIR focuses on real-time data, indicating the percentage of time your glucose remains in the target range. It fills a gap left by A1C, which doesn't show day-to-day variations and potential hypoglycemic events.
Together, these metrics paint a comprehensive picture of your glucose control. By learning how each one reflects a unique aspect of your health, you can take meaningful steps to manage your diabetes with confidence. Understanding your numbers empowers you to make informed decisions, celebrate progress, and stay on track toward your goals. Get started today by learning more about how to improve your glucose levels after meals here or downloading a diabetes app like SNAQ.
The SNAQ website does not contain medical advice. The contents of this website, such as text, graphics, images and other material are intended for informational and educational purposes only and not for the purpose of rendering medical advice. The contents of this website are not intended to substitute for professional medical advice, diagnosis or treatment. Please consult your healthcare professional for personalized medical advice.